MindBigData
"IMAGENET" of
The Brain
Files available for download (for raw EEG only current version is shown since it is
incremental) :
| DataBase | File | Zip size | Uncompressed size | Date | Images |
| Insight v1.04 Only EEG | MindBigData-Imagenet-IN.zip | 57 MB (60.572.900 bytes) | 430 MB | 07/03/2018 | 14,012 |
| Insight v1.0 EEG + Spectrogram | MindBigData-Imagenet-IN-v1.0.zip | 175 MB (184.463.366 bytes) | 440 MB | 04/17/2018 | 10,032 |
Feel free to test any machine learning, deep learning or whatever algorithm you think it could fit, or add them to your ImageNet pipeline to try to improve your performance, we only ask for acknowledging the source and please let us know of your performance to post it here!
Periodically the Data Base will be increased with more EEG signals , last update 07/03/2018, please feel free to forward any thoughts you may have for improving the dataset.
FILE FORMAT:
The data is stored in a very simple text format including 1 CSV file for each EEG data recorded related to a single image 14,012 so far.
The naming convention is as follows, for example lets use the file "MindBigData_Imagenet_Insight_n09835506_15262_1_20.csv"
MindBigData_Imagenet_Insight_ : ralates to the EEG headset used Insight atm only
n09835506 : ralates to category of the image from the synsent of ILSVRC2013 in this example n09835506 is "ballplayer, baseball player", I added a "WordReport-v1.04.txt" file too in the zip file with 3 files per row TAB separated with: the category names, the eeg image recorded count and the synsent ID
15262 : ralates to the exact image from the above category , all the images are from the ILSVRC2013_train dataset previously it could be downloaded from the Object Dectition challenge at the Kaggle Website, (imagenet_object_detection_train.tar.gz 56.68 GB), this image for example is n09835506_15262.JPEG from the ILSVRC2013_train\n09835506\ folder (atm looks like only this challenge is public)
_1_ : ralates to the number of EEG sessions recorded for this image, usually there will be only 1 but it is possible to have several brain recordings for the same image, second will be 2 and so on.
_20 : ralates to a global session number where the EEG signal for this image was recorded, to avoid long recording times only 5 images are shown in each session with 3 seconds of visualization and 3 seconds of black screen between them.
Inside the CSV file there are 5 lines of plain text one for each EEG channel recorded, ending with a new line escape character, in this example
AF3,4304.61538461538,4312.82051282051,4312.82051282051.................
AF4,4283.58974358974,4283.07692307692,4278.46153846154.................
T7,4307.69230769231,4318.97435897436,4337.94871794872.................
T8,4235.89743589744,4236.92307692308,4223.07692307692.................
Pz,4224.10256410256,4225.12820512821,4226.15384615385.................
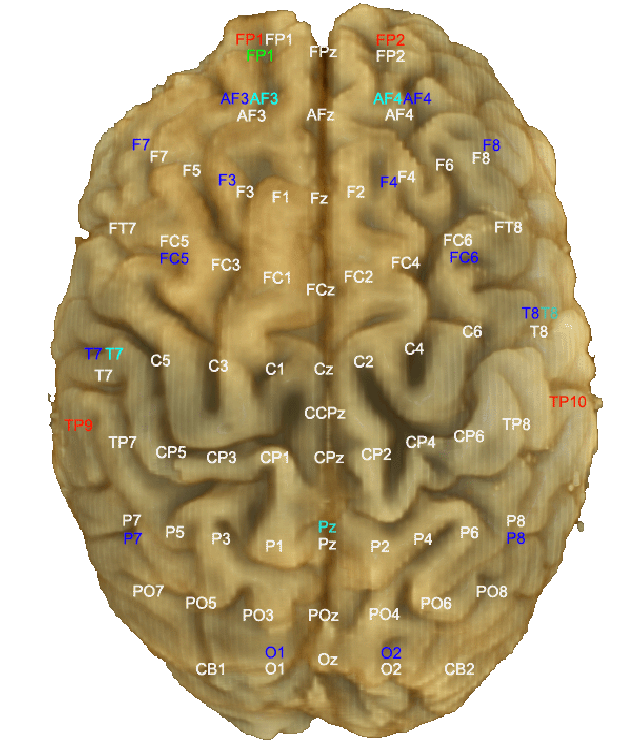
The first field of each line is a text string, to indentify the 10/20 brain location of the signal, with possible values: "AF3,"AF4","T7","T8","Pz" for the Insight Headset (look bellow for the brain locations)
After that, you have separated by a coma, all the raw EEG values capttured, for this headset it is done at 128Hz so there should be arround 384 (128 x 3 secs) decimal values like "4304.61538461538" for each channel note the dot is used for the decimal point
If you plot all the raw values for the AF3 channel (first line of the file) you have this signal:
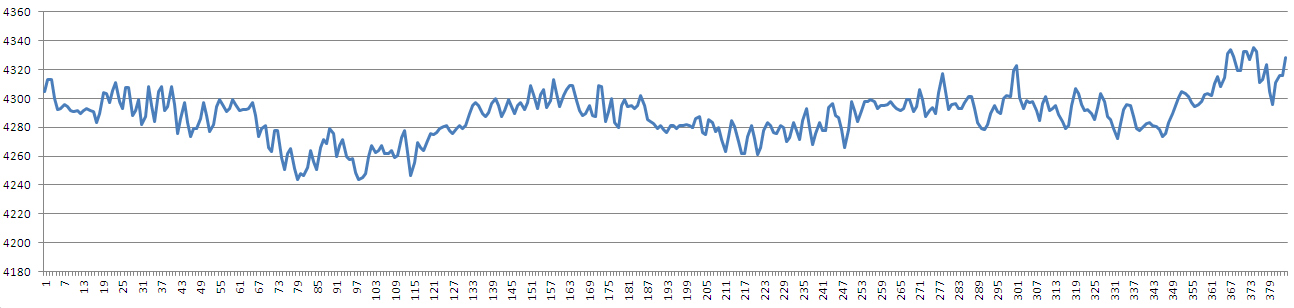
Note that this is the temporal series for the raw EEG electrical signal cuputured from my brain stearing at the image relatead above for 3 secs, without blinking and as still as possible to avoid EMG noise.
The other EEG channels follow the same pattern and the "time" coordinate of the time serie is shared between the 5 channels so the first "column" of numbers is the first time step and so on.
OPTIONAL SAMPLE SPECTROGRAM:
With the release of v.1.0 we include optionally a generated Spectrogram for each of the EEG captures, for a faster include into your existing image based deep learning pipeline, but we encourage to build your own one, based on the raw eeg data.
The sample spectrogram is created using only 3 of the 5 EEG Channels available, creating PNG RGB Files, AF3 channel is used as RED, AF4 as GREEN, and Pz as BLUE , this is just a sample case, for example you may want to build your own black & white files from the raw data and generating a PNG file for each channel.
To Generate the spectrogram for each raw eeg wave, the first 64 samples (1/2 seconds) are discarded to avoid possible communication lags, and then 128 samples are used to generate a FFT, and so on for each time step
Each time step is taken with a move ahead of 2 samples, until we reach 256 samples (2 seconds) so in total we cover 64 overlapped timesteps too. Probably the overlap is too big you may want to try smaller ones in your pre-processing pipeline.
Notice that for this sample scenario we are using the raw wave, but it is advisable to use some filters previously as the EEG literature suggest.
At the end we have 64 Frequencies (0 to 63hz) values (from the FFTs of 128 samples) for each of the overlapped 64 timesteps.
Notice also the the Frequencies included here are also not limited, and including, as the EEG literature suggest, some frequencies beyond what is expected for a brain signal. probably EMG or other signal artifacts.
Once we have the Frequency (magnitude) values, they are coded into color values (0-255) using EEG AF3 channel as RED, AF4 as GREEN and Pz as BLUE.
To reduce the effects of outliers, the frequency value distribution is proportionally mapped into the 0-255 value range for each color channel.
Here is a sample espectrogram amplified 10 times ( the ones included in the zip are only 64x64 pixels)
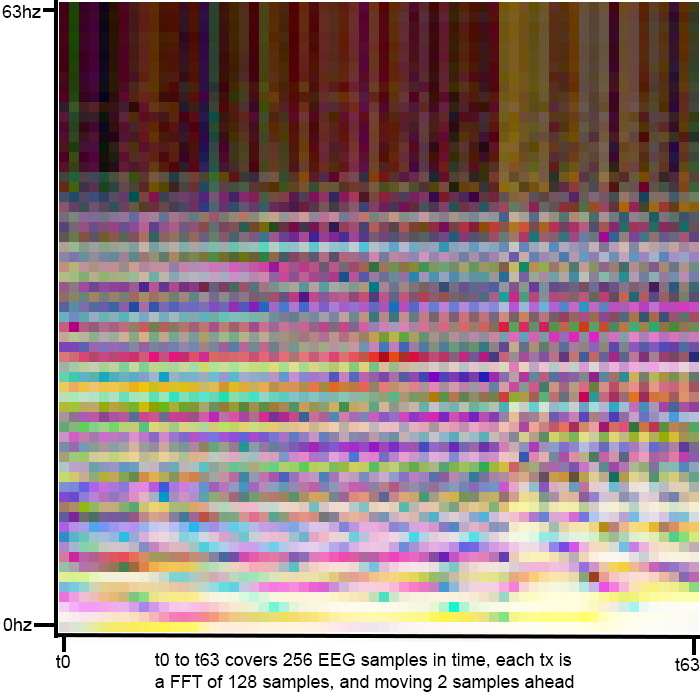
The name of the files will be the same as the csv but ending in .png and you can find them in the folder MindBigData-Imagenet-v1.0-Imgs
Beware that a few of the png files maybe filled mostly with a single color reflecting a probable unexpected capture flaw for the EEG device, and probably worth discarding.
BRAIN LOCATIONS:
Each EEG device capture the signals via different sensors, located in these areas of my brain, the color represents the device. Note that for the "IMAGENET" dataset only Insight is used atm
Feel free to Contact us if you need any more info, and glad to hear from your feedback.
PREVIOUS RESEARCH :
This is a list of realted work in the past, using other high density EEG devices:
- Deep Learning Human Mind for Automated Visual Classification | September 2, 2016 | Concetto Spampinato, Simone Palazzo, Isaak Kavasidis, Daniela Giordano, Mubarak Shah, Nasim Souly
- Personalized Image Classification from EEG Signals using Deep Learning | June 6, 2016 | Alberto Bozal
NEW RELATED RESEARCH :
- Inferencia de la Topologia de Grafs,Tura Gimeno Sabater, UPC 2020
- Understanding Brain Dynamics for Color Perception using Wearable EEG headband Mahima Chaudhary, Sumona Mukhopadhyay, Marin Litoiu, Lauren E Sergio, Meaghan S Adams York University, Toronto, Canada 2020
- Developing a Data Visualization Tool for the Evaluation Process of a Graphical User Authentication System Loizos Siakallis , UNIVERSITY OF CYPRUS USA 2020
- Research on Image Reconstruction Technology based on EEG and Deep Generative Network, Hou Kechen, Lanzhou University 2020
- Object classification from randomized EEG trials Hamad Ahmed, Ronnie B Wilbur,Hari M Bharadwaj and Jeffrey Mark, Purdue University CVPR 2021 USA 2021
- Evaluating the ML Models for MindBigData (IMAGENET) of the Brain Signals Priyanka Jain, Mayuresh Panchpor, Saumya Kushwaha and Naveen Kumar Jain, Artificial Intelligence Group, CDAC, Delhi 2022
- Fortifying Brain Signals for Robust Interpretation,Kanan Wahengbam; Kshetrimayum Linthoinganbi Devi; Aheibam Dinamani Singh, Indian Institute of Technology Guwahati Guwahati, India Nov-2022
- Pattern recognition and classification of EEG signals for identifying the human-specific behaviour Gunavathie MA, S. Jacophine Susmi, Panimalar Engineering College Chennai, University College of Engineering, Tindivanam 2023
- Reconstructing Static Memories from the Brain with EEG Feature Extraction and Generative Adversarial Networks Matthew Zhang Westlake High School, USA, and Jeremy Lu Saratoga High School, USA 2023
- A Novel Approach to Optimize Memory Reconstruction Using Joint Multimodal NetworksJeremy Lu,Cathy Messenger, USA 2023
- REEGNet: A resource efficient EEGNet for EEG trail classification in healthcare Khushiyant, | Mathur, Vidhu | Kumar, Sandeep | Shokeen, Vikrant 2024
- Alljoined1 -- A dataset for EEG-to-Image decoding Jonathan Xu, Bruno Aristimunha, Max Emanuel Feucht, Emma Qian, Charles Liu, Tazik Shahjahan, Martyna Spyra, Steven Zifan Zhang, Nicholas Short, Jioh Kim, Paula Perdomo, Ricky Renfeng Mao, Yashvir Sabharwal, Michael Ahedor Moaz Shoura, Adrian Nestor 2024
- Quantum Cognition-Inspired EEG-based Recommendation via Graph Neural Networks Jinkun Han, Wei Li, Yingshu Li, Zhipeng Cai 2024
Jan
26th 2026
David
Vivancos
vivancos@vivancos.com
This MindBigData The "IMAGENET" of
The Brain is made available under the Open Database License: http://opendatacommons.org/licenses/odbl/1.0/. Any rights in individual contents of the database are licensed under the Database Contents License: http://opendatacommons.org/licenses/dbcl/1.0/